スマート水圧監視システム

From field logger to server — a collection network we built ourselves, with no third-party relay

What is the Pressure Monitoring System?

IoT pressure loggers installed on the pipe network send pressure, flow, battery and link data to a collection server SR operates directly, letting you watch equipment health and network pressure on one screen.

There is no third-party cloud relay in the collection path. Devices connect directly to our server, which decodes their binary packets using our own specification. Because SR built every stage — registration, authentication, remote configuration and link monitoring — we can trace a field problem all the way down.

MQTT Direct device link
5min Link-loss watchdog cycle
2 Dedicated apps (Win · Android)
24,048 Shared elevation points
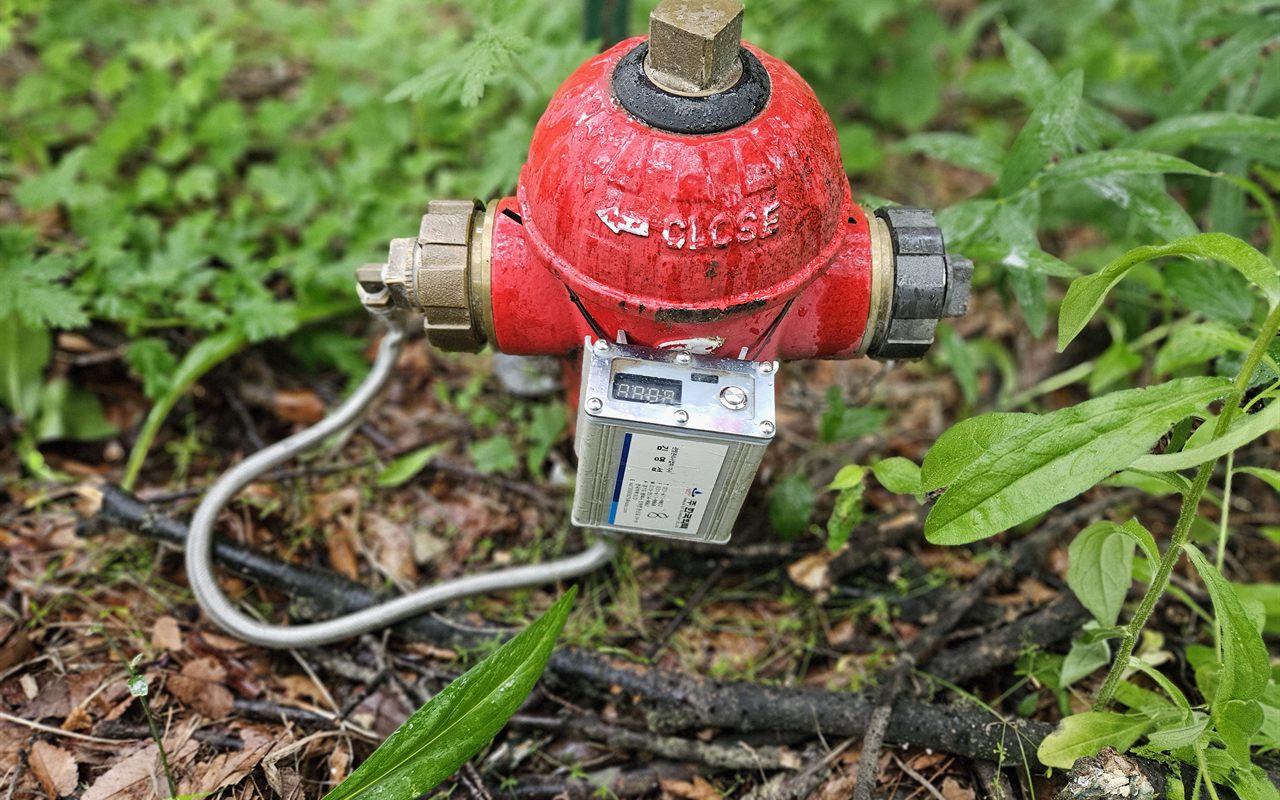
This Is How It Is Actually Installed

Photographed on pressure-survey sites carried out by SR

FIELD PHOTO A pressure logger connected to a fire hydrant outlet via adapter and pressure hose, mounted on a hydrant amid green undergrowth.
Hydrant Installation The logger attaches to the hydrant outlet through a dedicated adapter and pressure hose — no cutting into the main, no supply interruption, and it is recovered when the survey ends.
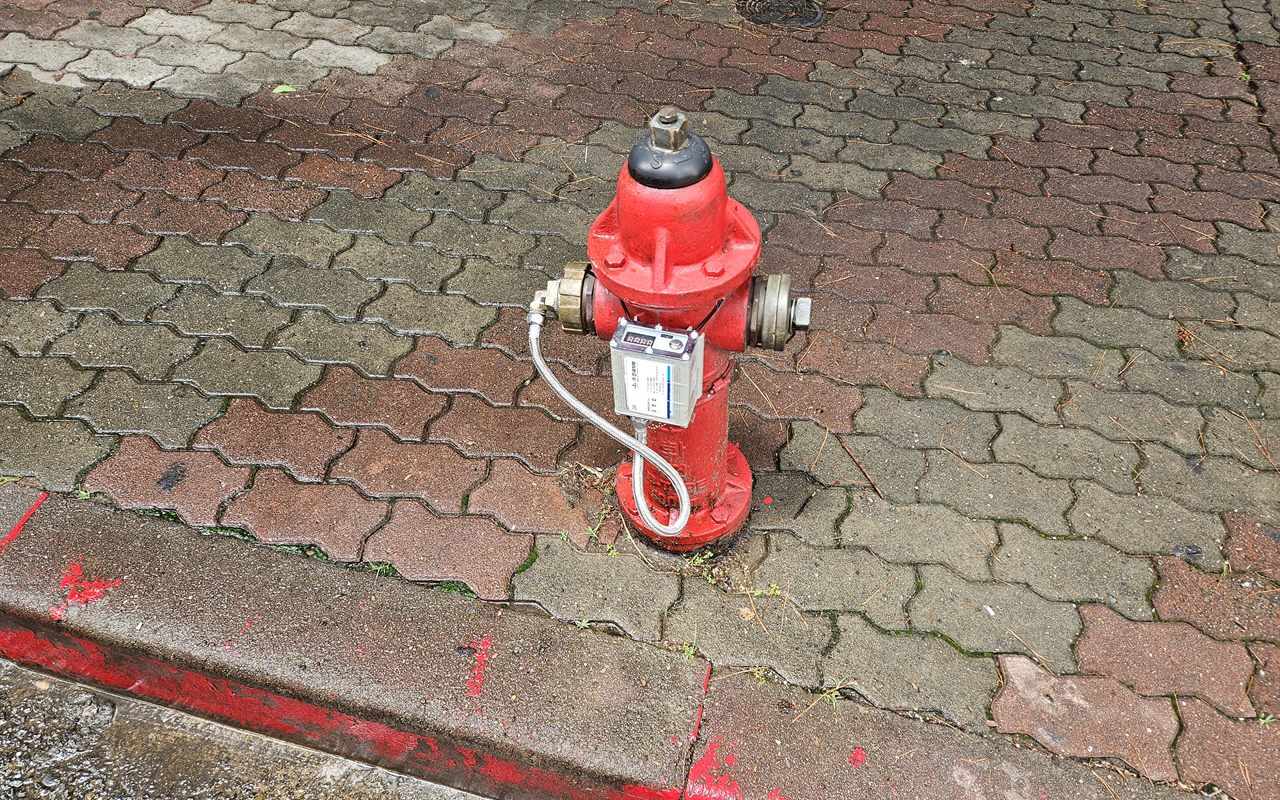
FIELD PHOTO A pressure logger installed on a street-side hydrant set in paving blocks in an urban area.
Urban Installation The same method applies to street-side hydrants in built-up areas. Measurement points are placed with block boundaries and network topology in mind.

Screens from the Running System

Not mock-ups — these are captured directly from the running system

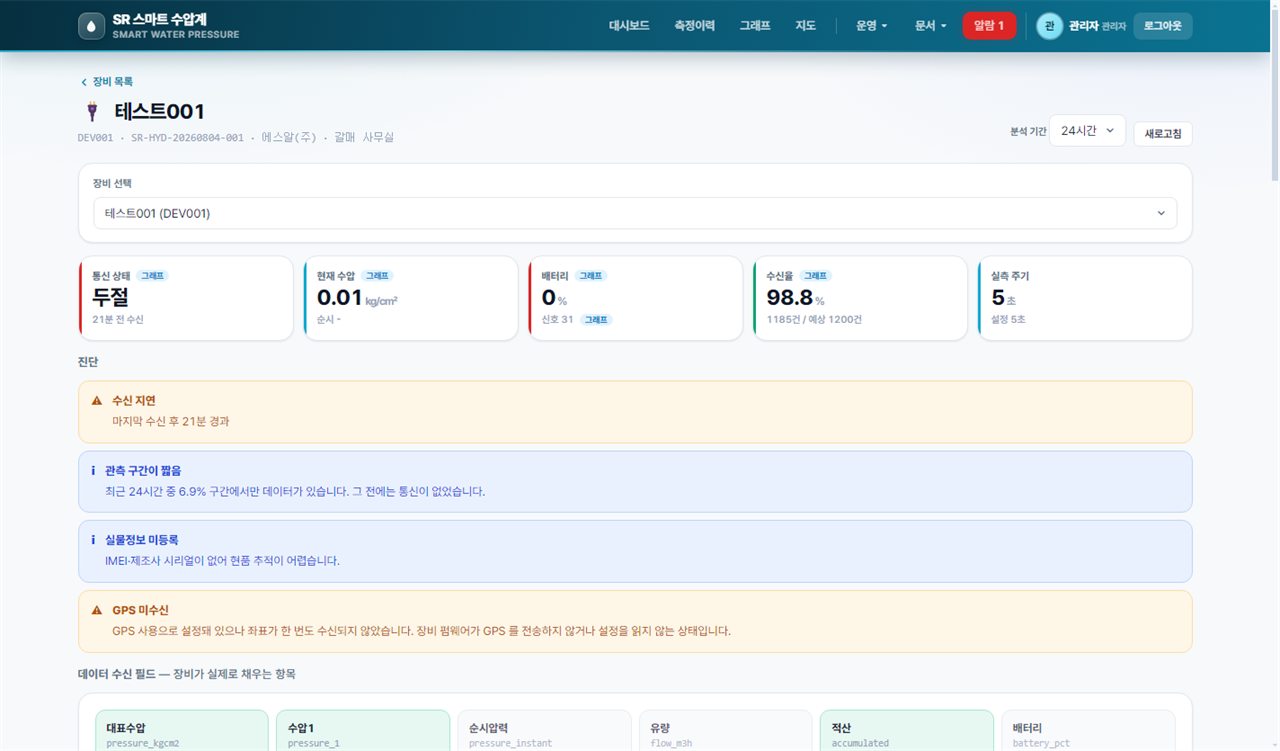
LIVE Device detail screen showing link status, current pressure, battery, reception rate and automatic diagnostics
Device Diagnostics Link status, pressure, battery and reception rate at a glance — the system itself flags issues such as delayed reception, short observation windows or missing GPS.
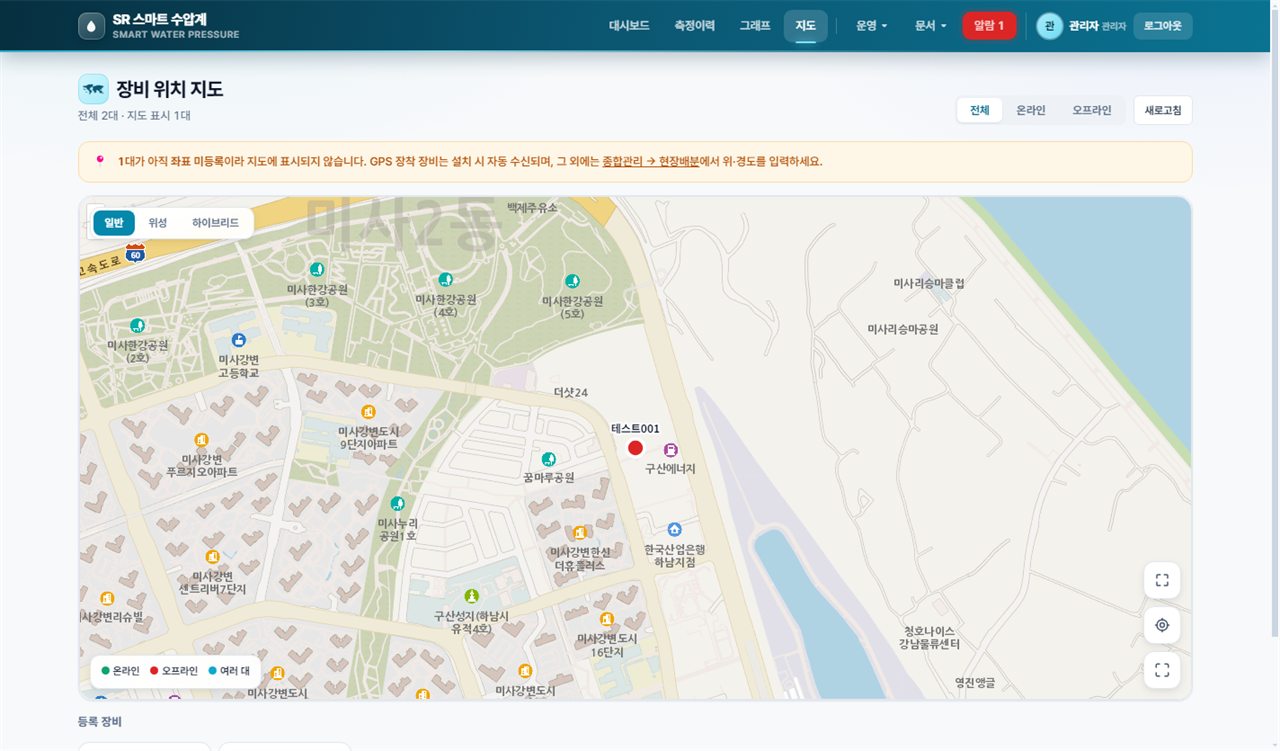
LIVE Device location map showing online and offline units colour-coded on the map
Device Map Installed units appear on the map as online or offline. GPS-equipped units report their coordinates automatically on installation; others are placed manually.
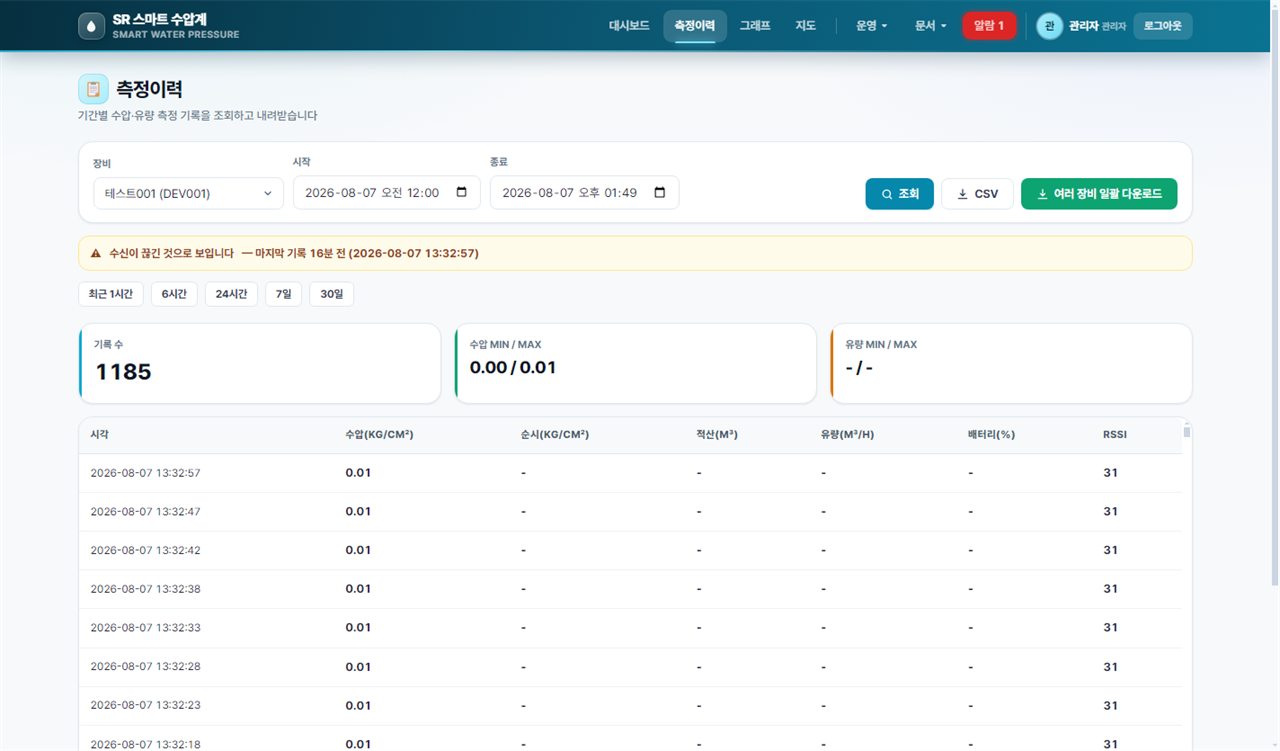
LIVE Measurement history screen with period search, CSV export and a link-loss warning banner
History & Export Query pressure and flow records by period and export to CSV, several devices at once. Units that have stopped reporting are flagged right on the screen.

Key System Features

In-house Collection Network

Devices connect straight to the SR collection server, which decodes their binary records against our own specification.

  • Direct MQTT link, no external relay
  • In-house binary packet decoding
  • Parallel HTTP ingest path

Self-registration & Token Auth

Field engineers register a device themselves using a registration key. Every subsequent upload is authenticated with a per-device token.

  • Hashed keys with expiry and use limits
  • Uploads without a token are rejected
  • Controlled per-device token reissue

Link-loss Watchdog

Every five minutes the system checks all devices and raises an alarm for any unit that has gone silent or is running low on battery.

  • Automatic no-signal and low-battery alarms
  • Collection server self-heals on failure
  • Per-device reception rate and gap analysis

Elevation-based Expected Pressure

The installation elevation is fetched automatically and combined with ground level and water level to compute expected static pressure for comparison with the measured value.

  • Shares elevation data with WaterNet
  • Unknown coordinates are fetched and cached
  • Residual-pressure ratio against expectation

Remote Configuration

Change sampling interval, transmit interval, battery-check interval, GPS use and sleep duration from the server — no site visit required.

  • Remote sampling/transmit interval control
  • GPS use and sleep duration settings
  • Applied changes are logged

Isolation Assessment Engine

An engine that judges isolation from the pressure drop across valve closure, the slope of the plateau, whether pressure recovers, and correlation with an outside reference point.

  • Drop magnitude and plateau analysis
  • Correlation check against outside reference
  • Preparing for field deployment
On these claims. Every feature described here is implemented and running in the current system. The isolation assessment engine is complete in algorithm and UI but is still being prepared for field deployment, and is labelled as such. We demonstrate the live system on request.

Dedicated-application Access Policy

Water network data is not a public asset. We start by narrowing the way in.

Dedicated Applications

DesktopWindows installer application
MobileAndroid application
UpdatesAuto-check with enforced minimum version
Stay signed inDedicated apps only — blocked on shared PCs

Roles & Isolation

RolesSuper-admin / company admin / user
DataFull per-company isolation across all views
RoutingUsers are redirected away from admin screens
PasswordsHashed, never stored in plain text

Collected Fields

PressureRepresentative, per-line and instantaneous
FlowInstantaneous and totalised flow
DeviceBattery voltage/level, RSSI, power mode
LocationGPS latitude, longitude, altitude

How It Connects to Our Other Systems

Considering pressure monitoring?

SR handles the loggers, installation, collection server and operation. We will demonstrate on the live system.

Contact Us See WaterNet