智慧管网管理系统

IoT·AI·云基础的下一代自来水综合管理平台

What is Water Network Management?

Our Water Network Management System is an integrated platform that collects and analyzes real-time flow, pressure, and water quality data to achieve leak detection, quality anomaly detection, and operational efficiency optimization.

SR GROUP combines over 20 years of water infrastructure experience with cutting-edge IoT and AI technology to innovatively improve water management operations for municipalities and public institutions.

24/7 Real-time Monitoring
30%+ Leak Reduction
75만+ Managed Assets
9 Deployed Sites

Key System Features

Introducing the core features of our Water Network Management System

GIS-based Network Map

Intuitively display sensor locations, pipe information, and real-time measurements on GIS-based network maps.

  • Pipe, valve, meter location display
  • Real-time sensor data overlay
  • Layer filtering (pressure/flow/quality)

Real-time Monitoring

Monitor flow, pressure, water quality, and residual chlorine data in real-time on a unified dashboard.

  • Real-time status dashboard
  • Automatic anomaly detection & alerts
  • Trend graphs & comparative analysis

Leak Detection System

Automatically detect leak zones through night-time minimum flow analysis, zone-based flow comparison, and AI pattern analysis.

  • Minimum Night Flow (MNF) analysis
  • DMA block water balance analysis
  • AI-based leak pattern prediction

Water Quality Management

Real-time monitoring of turbidity, residual chlorine, pH, and conductivity to ensure safe water supply.

  • Multi-parameter water quality sensor
  • Immediate alert on threshold breach
  • Quality history tracking & reporting

Alarm & Notification

Instantly notify via SMS, email, and app push when abnormal conditions exceed set thresholds.

  • Multi-level alarm (caution/warning/danger)
  • SMS, email, app push notification
  • Alarm history management & statistics

Reports & Analysis

Automatically generate daily/weekly/monthly/annual reports with various analysis functions.

  • Revenue water rate & water balance
  • Energy efficiency analysis report
  • Customizable report templates

System Architecture

See the complete data flow from field to server at a glance

Field Layer
Flow Meter
Pressure Sensor
Quality Sensor
Temp Sensor
Collection
RTU/Data Logger
LTE/LoRa Comm
VPN Security
Server/Cloud
Database
Analytics Engine
AI Module
User Interface
Web Dashboard
Mobile App
Control Room

Benefits of Implementation

01

Revenue Water Improvement

Improve revenue water rate by 5-15% through real-time leak detection and precise flow analysis.

02

Cost Reduction

Reduce patrol frequency with automated monitoring and save up to 20% on energy costs through optimization.

03

Water Quality Safety

Prevent water quality incidents through real-time monitoring and anomaly detection.

04

Rapid Incident Response

Receive immediate alerts during pipe breaks or contamination events for golden-time response.

05

Data-driven Decisions

Support rational decision-making for pipe replacement priorities and facility investment plans.

06

Reduced Complaints

Detect and resolve pressure imbalance and quality issues proactively to reduce resident complaints.

Technical Specifications

Measurement Equipment

Flow MeterUltrasonic/Electromagnetic (±0.5% accuracy)
Pressure Sensor0-25 bar, ±0.1% FS precision
Quality SensorTurbidity, Cl₂, pH, conductivity, temp
Data LoggerMulti-channel, built-in battery, IP67

Communication & Server

CommunicationLTE Cat.M1 / LoRaWAN / NB-IoT
ProtocolMQTT, Modbus TCP/RTU, OPC-UA
ServerOn-premise / Cloud (AWS, NHN)
SecurityVPN, TLS 1.3, access control

Software

ClientDedicated client (PC installer · mobile app)
GIS EngineOpenLayers / Naver/Kakao Map
AI AnalyticsLSTM, Random Forest, Anomaly Detection
IntegrationSCADA, Municipal admin, ERP integration

Screens from the Running System

Not mock-ups — captured directly from the running system

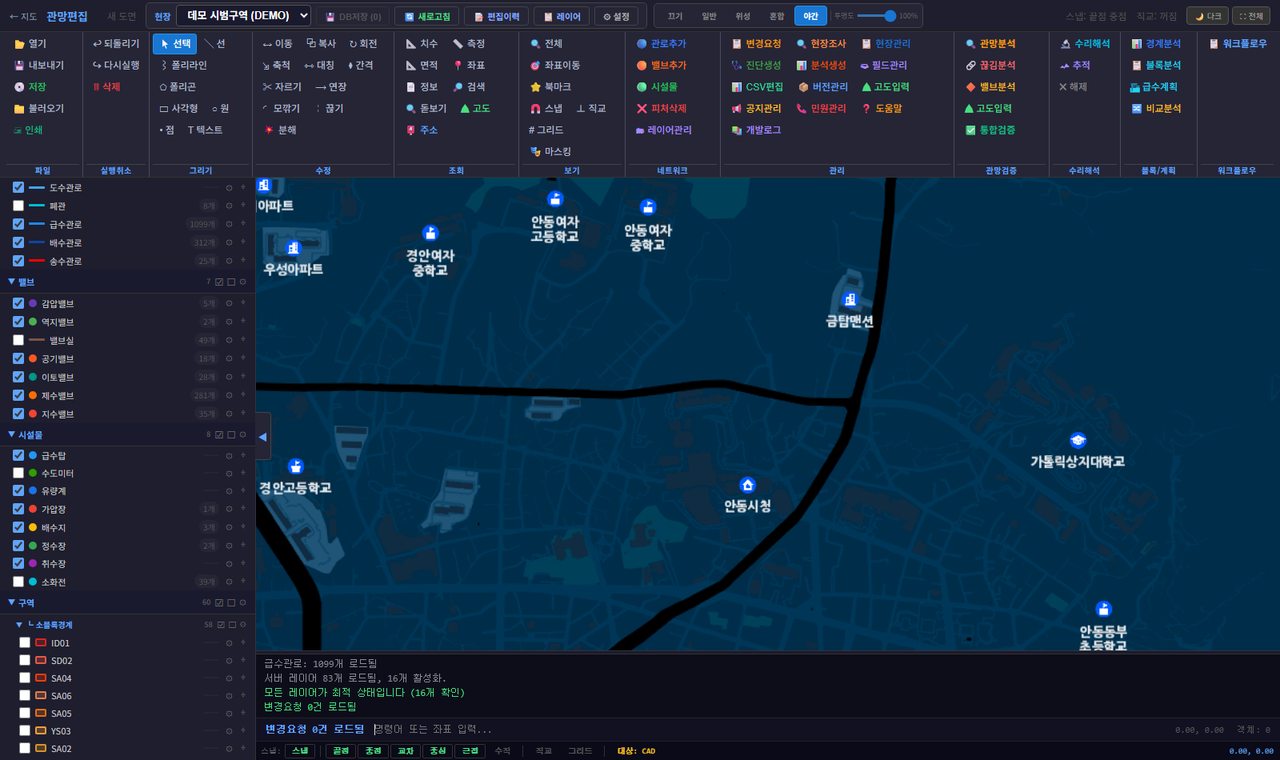
LIVE GIS network map with pipes, valves and facilities displayed as layers, with layer and length management on the left
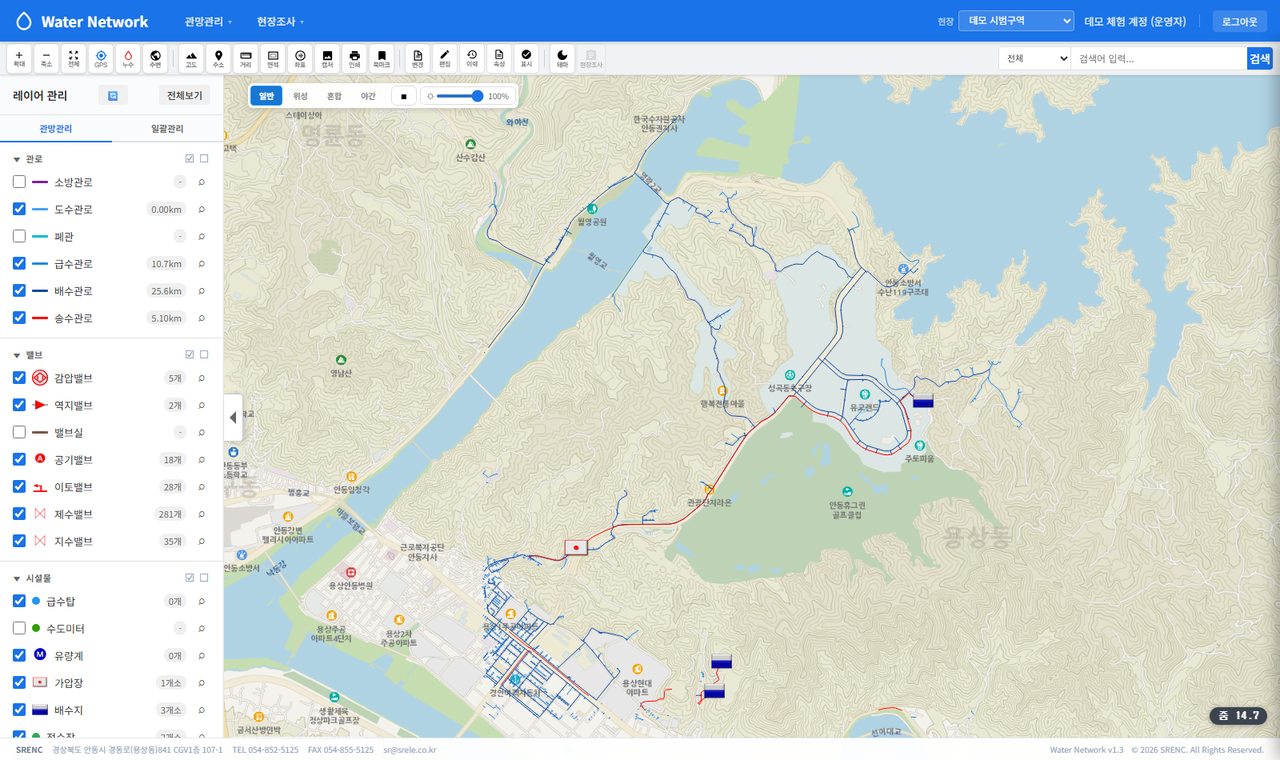
GIS Network Map Transmission, distribution and service mains, valves and facilities are split into layers, with lengths and counts tallied live per layer.
LIVE CAD network editing mode with ribbon tools for adding pipes and valves, snapping, dimensioning and network analysis
CAD Network Editing Draw and correct the network inside the system, with no separate CAD package — snapping, dimensioning, validation and hydraulic tools in one place.
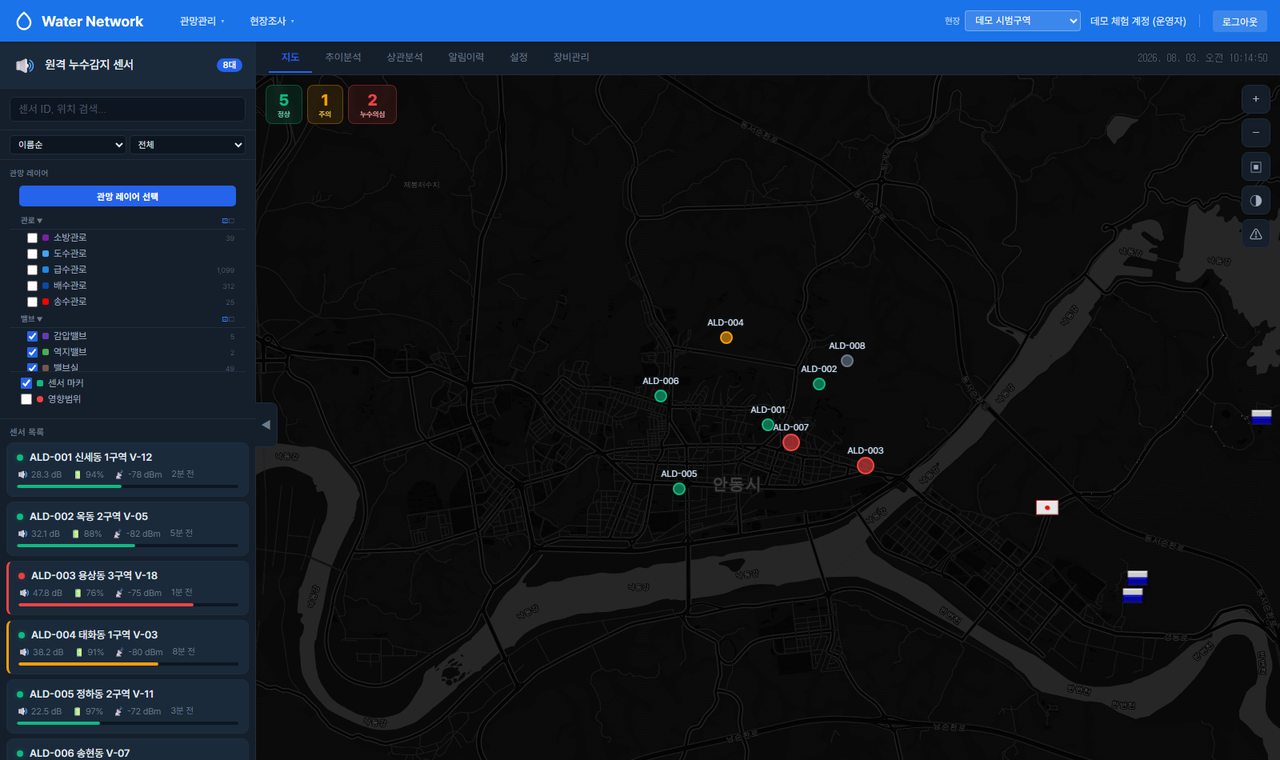
LIVE Remote leak-detection screen grouping sensors into normal, caution and suspected-leak, shown on a map and list with acoustic level and battery
Remote Leak Detection Leak sensors are grouped into normal, caution and suspected-leak on both map and list, alongside acoustic level, battery and link quality.
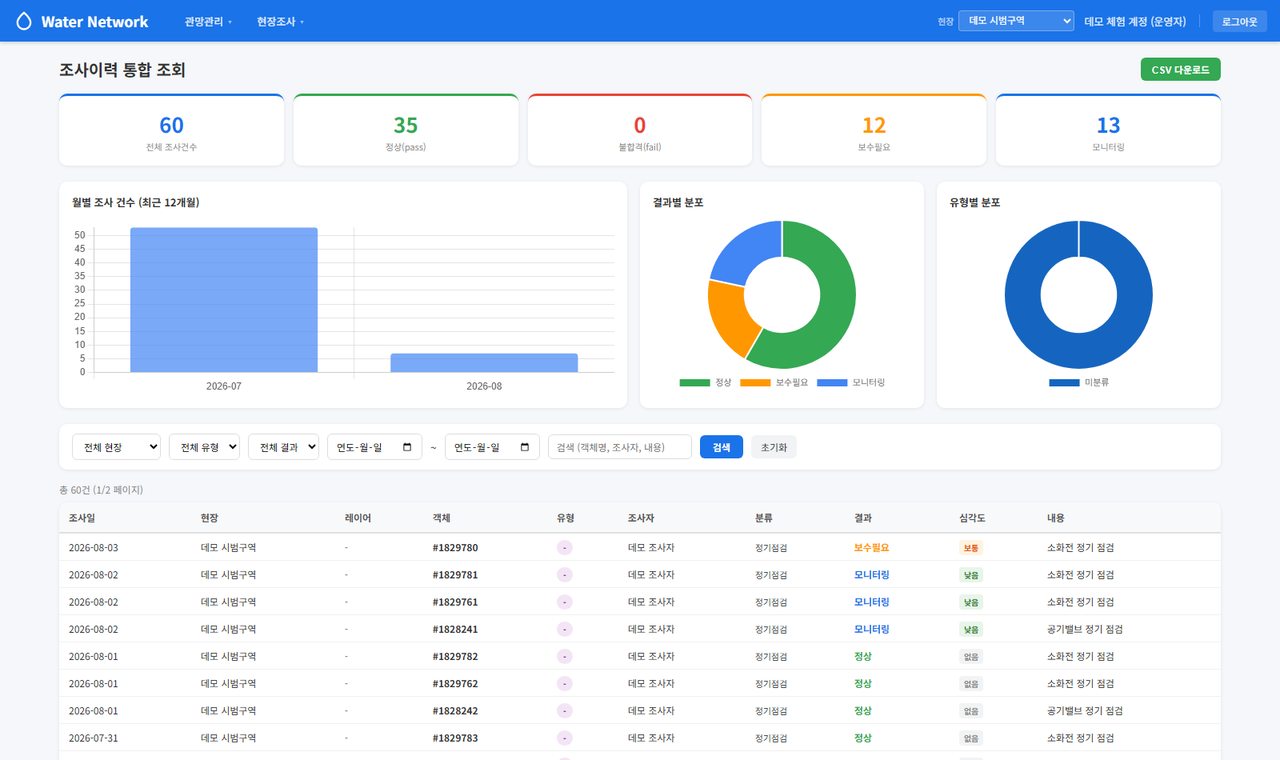
LIVE Inspection history dashboard showing total counts with result and type distribution charts, and a detailed record table below
Inspection History Field inspections accumulate against each asset — tallied as pass, repair-needed or monitoring, charted by month and exportable to CSV.

Systems Connected to WaterNet

From field instruments to radio and groupware — what is actually connected, and what is still planned

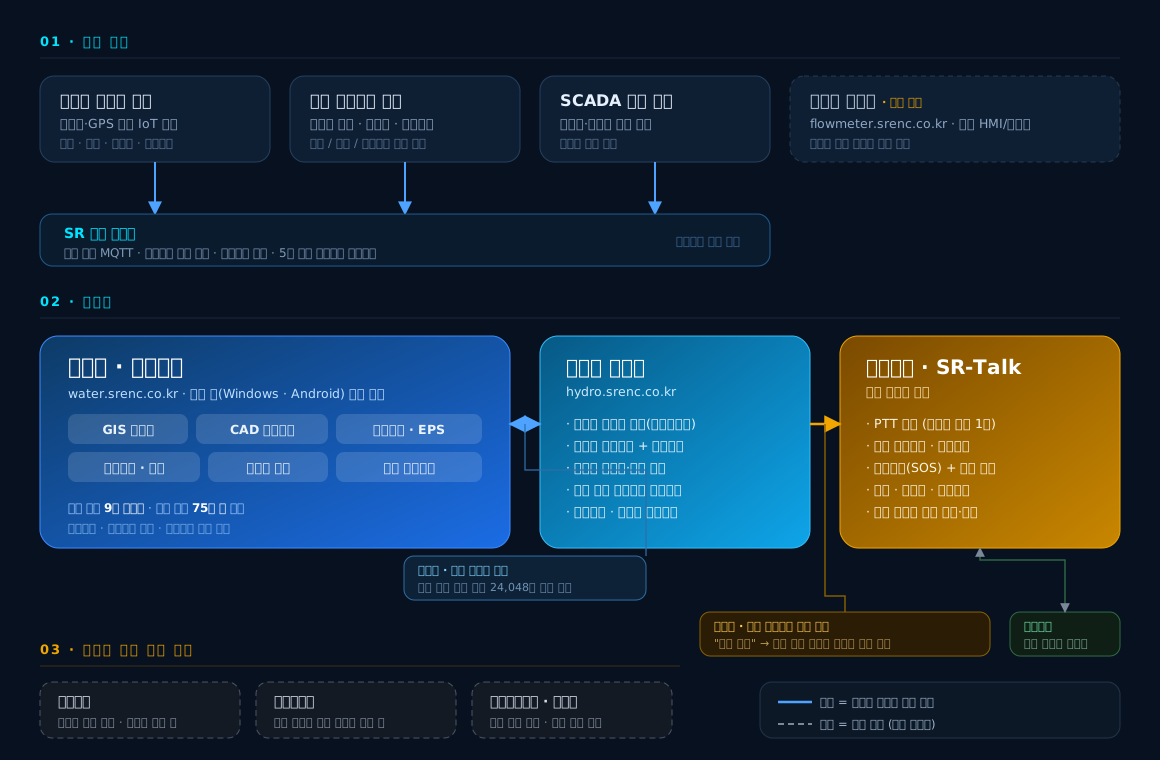
WaterNet ecosystem diagram. Field instruments feed the SR collection network into WaterNet; WaterNet shares elevation data with the pressure system, which in turn connects to SR-Talk radio, which uses groupware accounts. Complaint management, facility management, permit-to-work and the flow meter system are shown as planned with dashed outlines.
On this diagram. Solid lines mark integrations verified in code, where data actually moves between systems. Dashed lines mark planned work that is not connected yet — nothing planned is presented as done. We demonstrate the live systems and their integrations on request.

Considering implementing a water management system?

We support from field survey to design, construction, and operation. Consult with our engineers.

Contact Us Request a Demo Software Portal